Advantage:
1. Functional modules with cell imaging system extend the detection application of microplate readers
2. Easily detect the expression level of the tagged protein per cell or per well
3. Follow the simple process of a general micro-hole reader
4. Cell visualization data output increases data credibility
The presence or absence of certain cellular proteins may represent a cell's response to certain stimuli, a differentiated state, or a unique characteristic of a particular cell type or successful transfection of a gene. For example, vascular endothelial cell adhesion molecule-1 (VCAM-1) is generally not present in normal vascular endothelial cells, but VCAM-1 expression occurs in the inflammatory response caused by the stimulation of the cytokine TNF-α in vitro. The expression of a particular marker protein in such cells can be easily detected and quantified using a microplate imaging system.
Quantitative measurement of expression of cell markers
Human umbilical vein endothelial cells (HUVEC) were cultured for 48 hours in 96-well plates, followed by stimulation with different doses of anti-inflammatory compounds SB202 and SB203 for 2 hours; then stimulated with TNF- for 24 hours, cells expressed VCAM-1; then 4% The paraformaldehyde was fixed to the cells and then stained with an anti-VCAM fluorescein-labeled antibody. Cell imaging was performed using a Spectra M ax M in iMax Cell Imaging System (a user-upgradeable module of the SpectraMax i3 Multi-Purpose Reader), which was performed in real time using the Protein Expression Protocol in Soft-Max Pro software. Evaluation of the potency of the compounds was carried out using a concentration effect curve fit of SoftMax Pro, and the results showed that the compounds successfully inhibited the stimulation of cytokines, thereby inhibiting the expression of subsequent VCAM-1.
Quantification of the expression level of VCAM-1, filtering out background impurities and size thresholds by setting the fluorescence intensity threshold to filter out minute impurities such as scratches, particles or bubbles. Figure 1 shows how the protein marker analysis setup procedure is performed in SoftMax Pro.
Fixed cells stained with fluorescein-labeled VCAM antibodies were identified using a tagged protein expression program. Since the cells were almost contiguous, this procedure was set up to detect overall protein expression throughout the field of view, rather than performing a single cell count.
Figure 1 Test analysis parameter settings before positive and negative samples are read
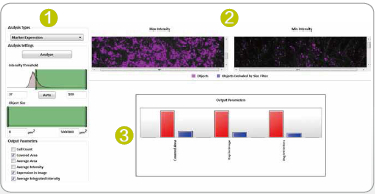
Figure 1. The SoftMax Pro software interface has several visual components to help set the optimal parameter settings for image segmentation.
1: Adjust the background intensity and object size thresholds to identify fluorescent cells.
2: Visualize the generated segmentation masks within the positive and negative wells to help determine if further parameter adjustments are needed.
3: Select an output parameter that can display a direct difference between the positive and negative holes, such as the display of the histogram.
The labeled expression program is the region used to identify the fluorescein-labeled anti-VCAM antibody marker. The presence of VCAM-1 represents a positive response to the inflammatory response.
Figure 2 Response of cells to anti-inflammatory compounds
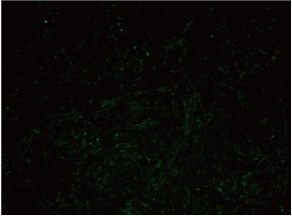
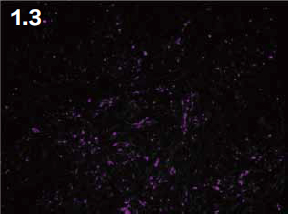
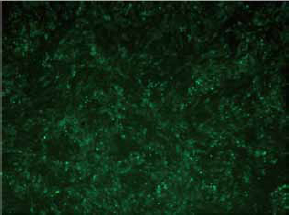
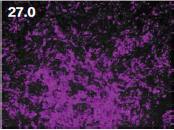
The image on the left shows cells expressing fluorescent VCAM-1, the right panel plus a purple mask showing the division of the expression of the inflammatory tagged protein; the high dose of anti-inflammatory compound SB202 treated cells (upper row) shows very little Expression of VCAM-1, while low-dose anti-inflammatory compound SB202-treated cells (lower row) expressed a large amount of VCAM-1 after using cytokines. All values ​​are the total intensity values ​​after normalization.
More information on marker expression analysis experiments
The SpectraMax MiniMax Cell Imaging System provides visual data and information that is not available with simple enzyme-labeled fluorescence intensity measurements. The fluorescent detection region can be localized to cells expressing the tag of interest, and the large imaging field allows for the integration of a large number of cells at once. The friendly SoftMax Pro software analysis interface allows for concentration effect curve fitting and calculation of IC50 values. In summary, the MiniMax Cell Imaging System simplifies the cell imaging process and provides and supplements important information that cannot be provided by standard microplate reader assays for the detection of cellular tagged proteins.
Figure 3 Analysis of the expression of the markers
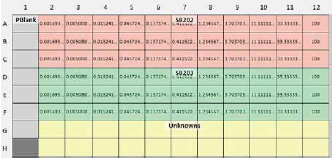
Top: Annotated definition of the hole in the microplate template.
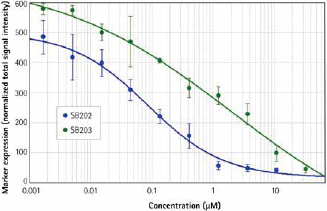
Bottom: Curve fit plot of concentration vs. marker expression. As the concentration of anti-inflammatory compounds increases, the amount of cytokine-stimulated VCAM-1 expression decreases. The normalized total signal strength can be used with a number of curve fitting options and give IC50 concentrations. SB202 IC50 = 0.1 μM, SB203 IC50 = 1.8 μM.
Flood Control Damper,Dam Easy Barrier,Flood Barrier System,Flood Barrier For Door
Denilco Environmental technology(Suzhou)Co., Ltd. , https://www.wflood.com